
A fast 0-10 read on company quality.
Open the company report and start from comparable score context before you sink time into every raw metric.
Fintrics scores public companies against historic sector data, then shows what changed, why it moved, and what deserves review next.
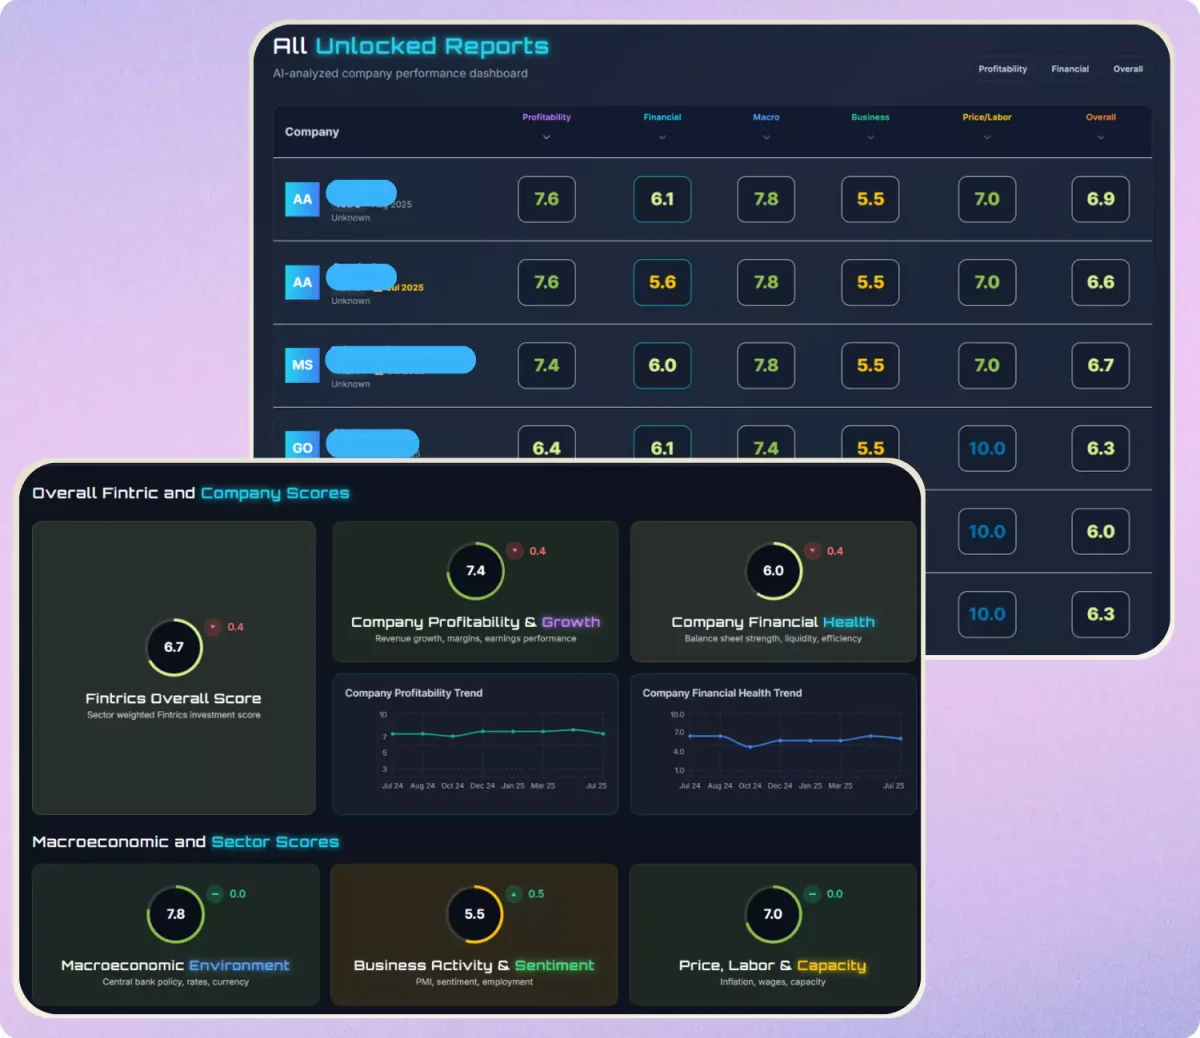
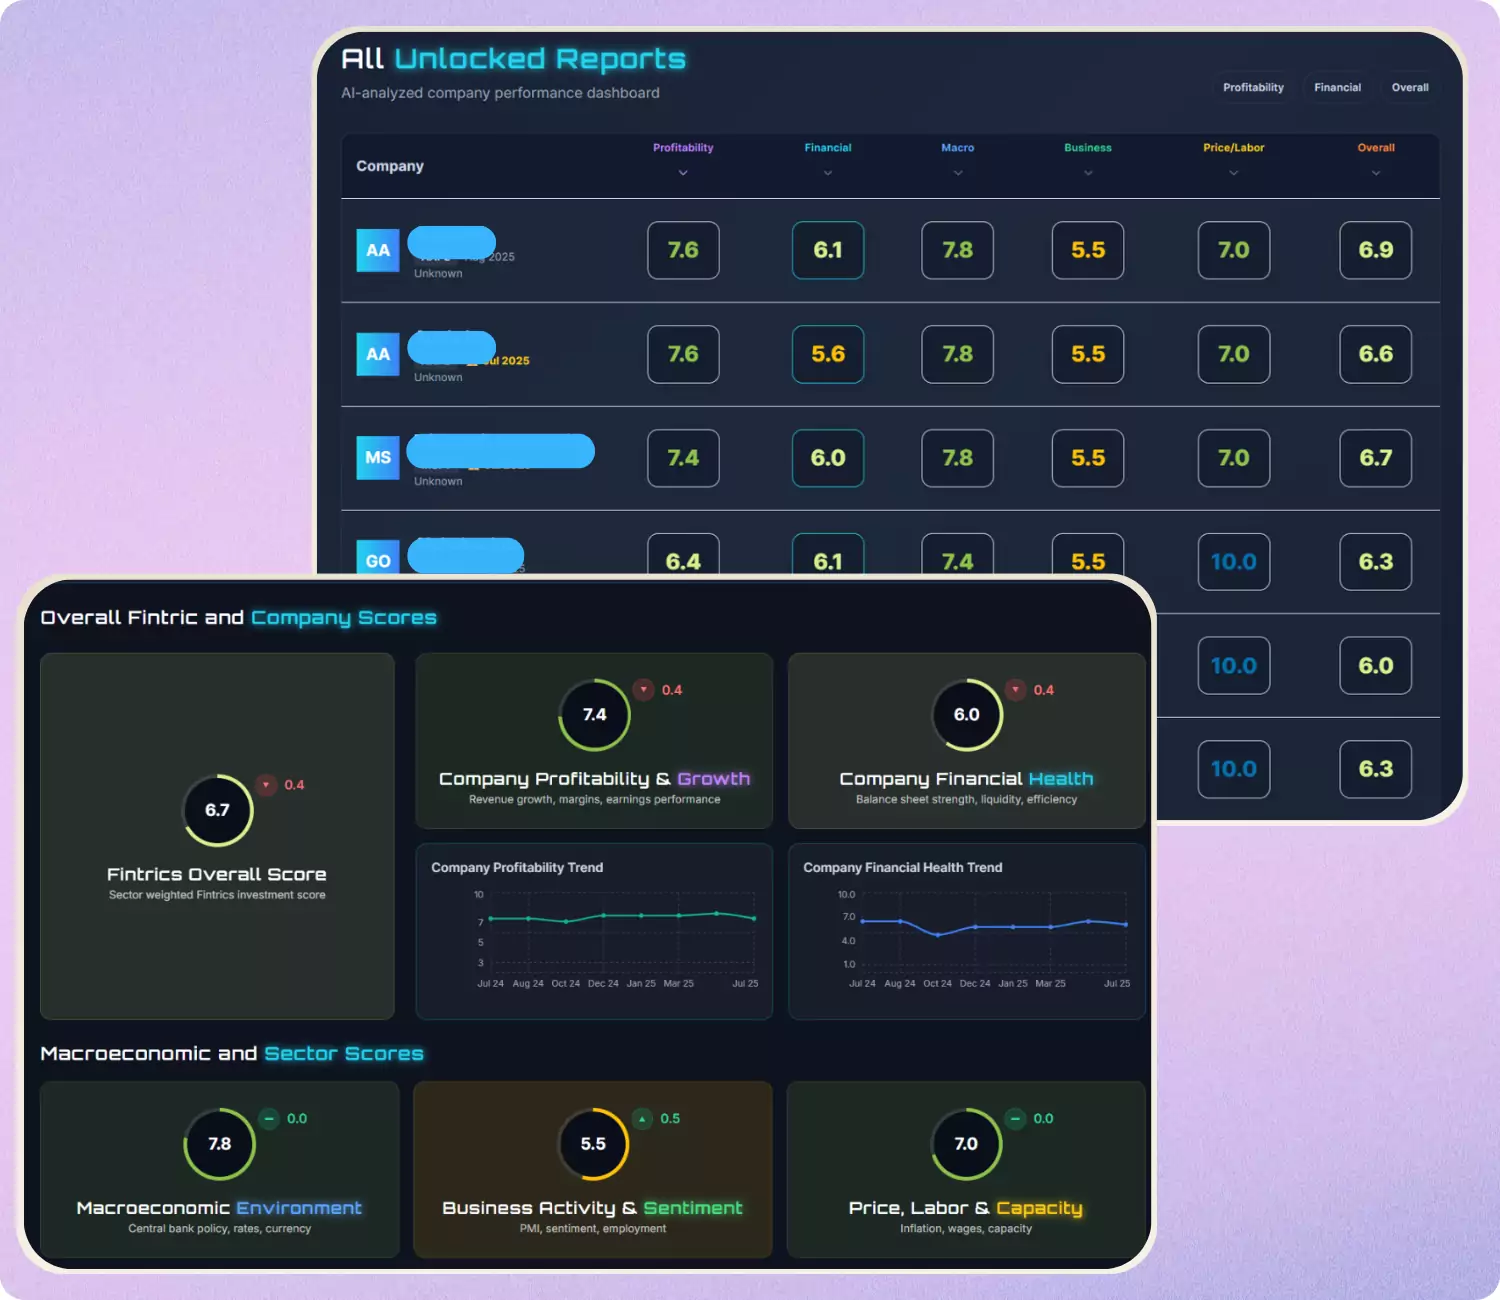
Fintrics gives users a faster report review, cleaner sector context, and visible score changes.
Open the company report and start from comparable score context before you sink time into every raw metric.
Margins, leverage, growth, and profitability mean different things by sector. Fintrics keeps that context visible.
Watchlist and market updates surface one-decimal score changes with category drivers behind the move.
Fintrics keeps the dashboard, company report, and score drivers close together so the next research step is easier to choose.
Search, compare, and open companies from a dashboard that keeps overall scores, category scores, and movement in view.
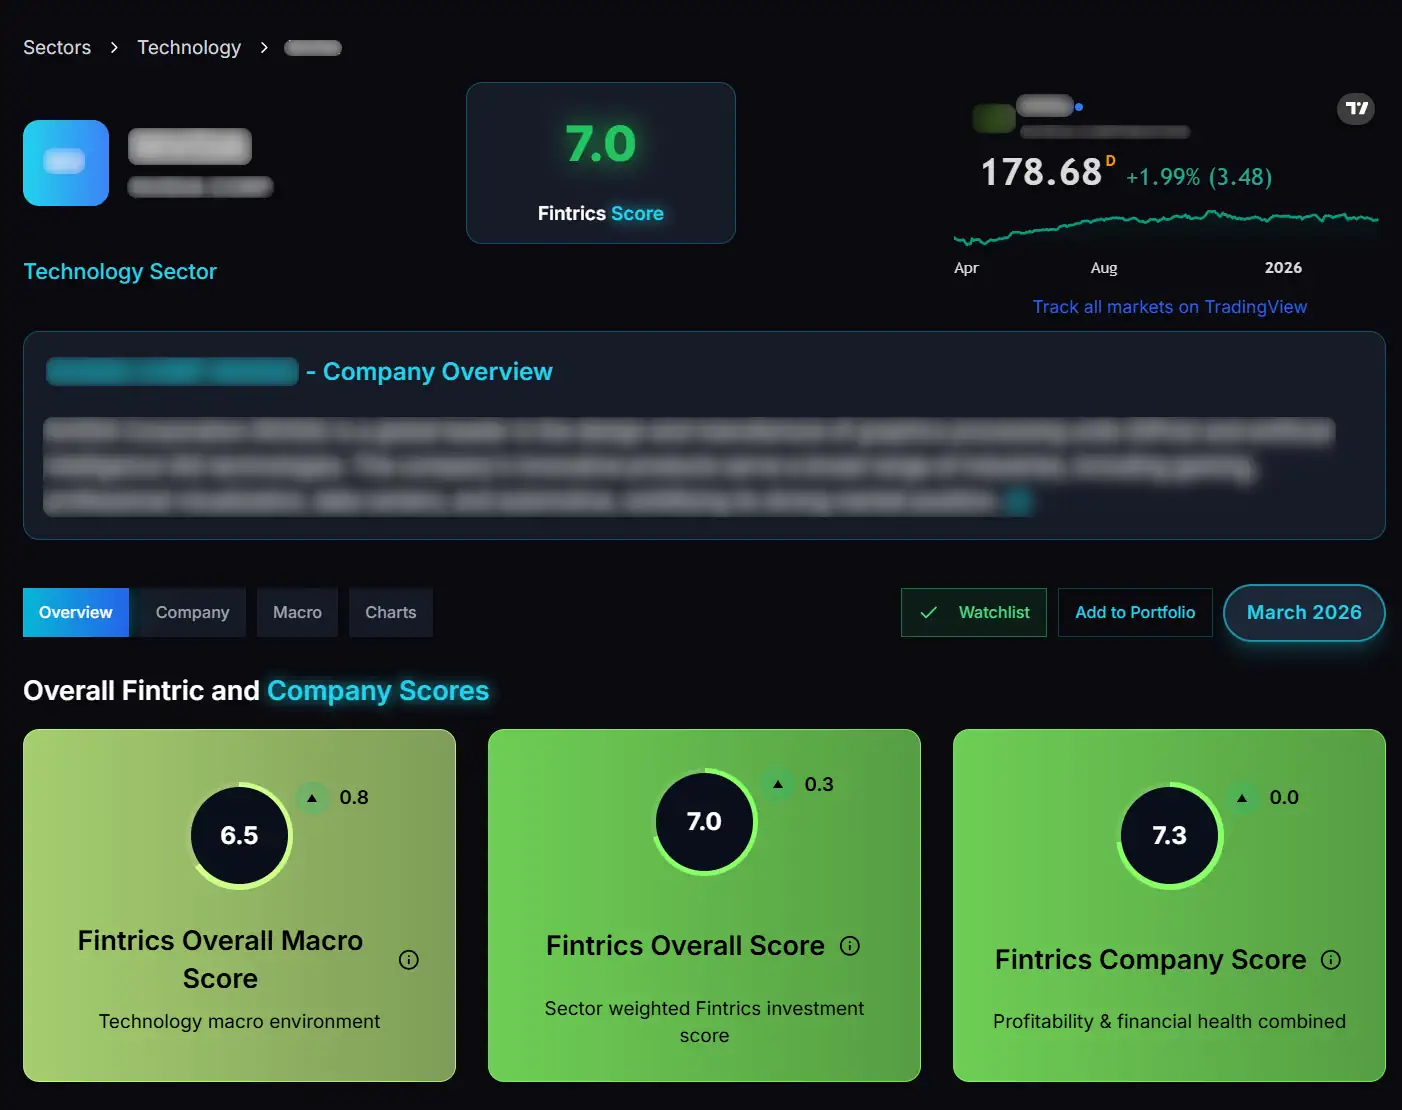
Move into a company page with the headline score, sector context, chart area, tabs, and watchlist action in view.
Scan the category cards and movement cues before deciding which metric or report section deserves deeper research.
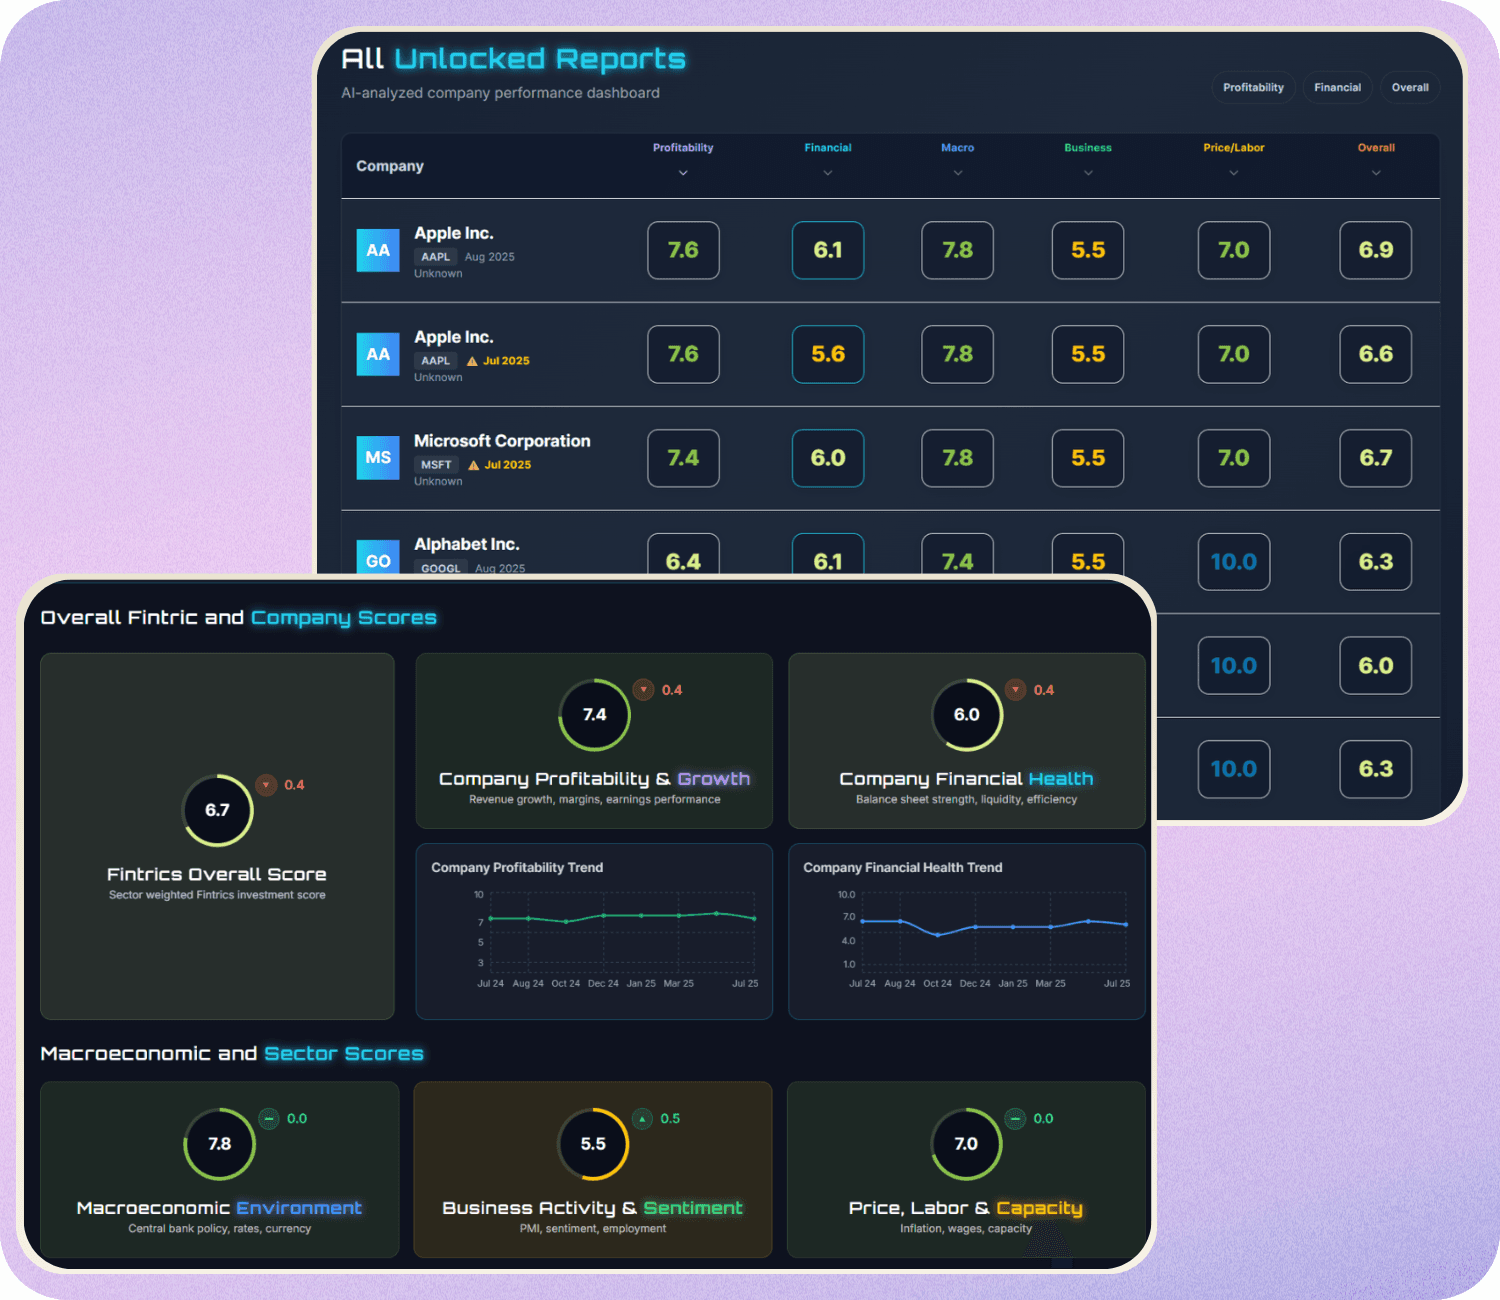
Search a company, open the scored report, scan the performance history, then decide what deserves deeper research.
See sample reportsMove from company lookup to report context.
Review overall, company, profitability, health, and growth context.
See which score category moved and what deserves a deeper look.
A margin level in one sector can be normal in another. Fintrics keeps the sector lens central so company scores are easier to compare.
Fintrics turns sector history into a practical scoring layer so the user can compare companies without manually rebuilding every peer and sector benchmark.
Fintrics brings recent changes, reason lines, review queue, and watchlist status into one loop.
Why: Profitability +0.3, Company Score +0.1
Why: Financial health +0.4, revenue growth +0.2
Why: Margin pressure -0.1
Fintrics is not another static metrics table. It becomes the place where users decide what to monitor, challenge, support, and review.
Sort stocks by score movement, lower scores, and report freshness.
Track why you are watching a company and which risk needs attention.
Reuse Fintrics score filters for profitability, financial health, margins, and balance sheet strength.
Fintrics keeps the data boundary clear while organizing company context, score history, and source-aware metrics for independent research.
Explore the dashboard, unlock starter reports, and understand the product before paying.
Includes starter report access, basic stock analysis, and the first step into the Fintrics research workflow.
Explore the dashboard for free, then unlock more reports as your research process gets more active.